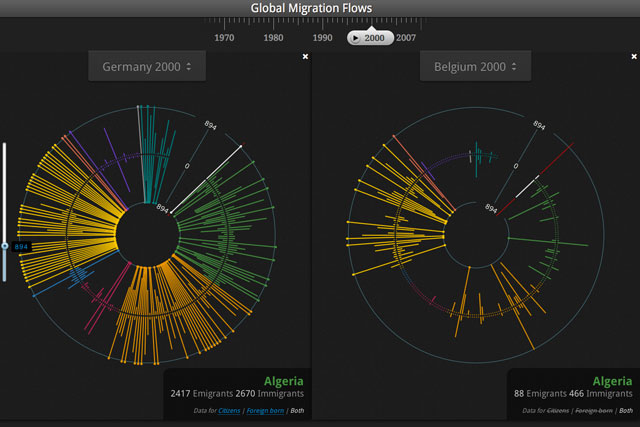
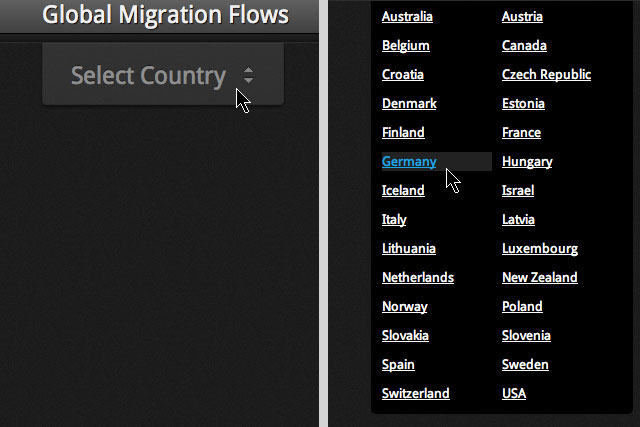
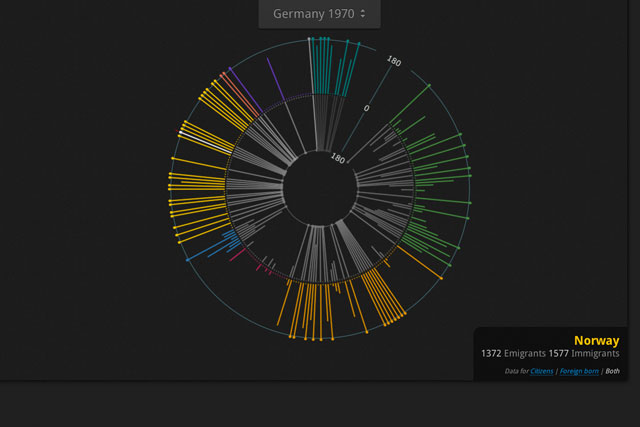
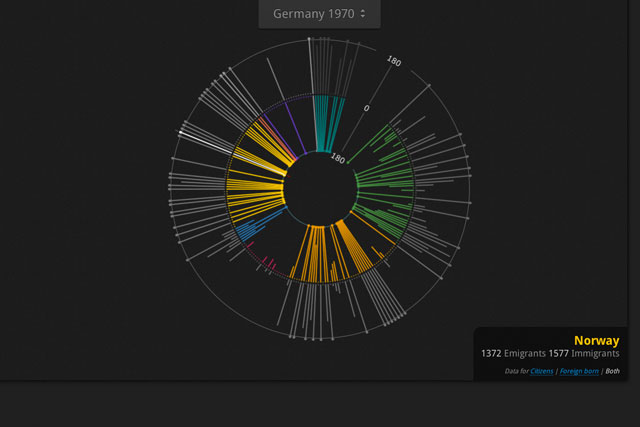
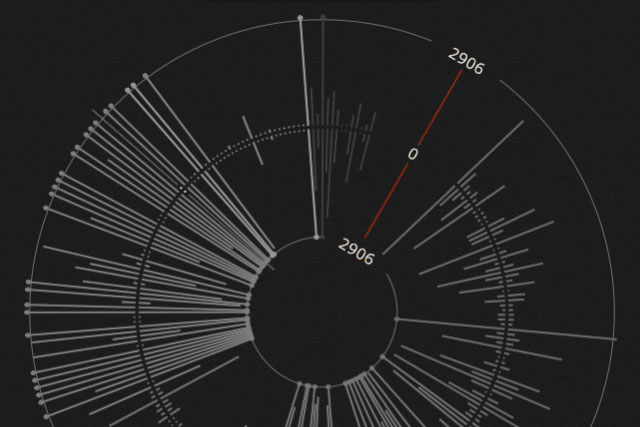
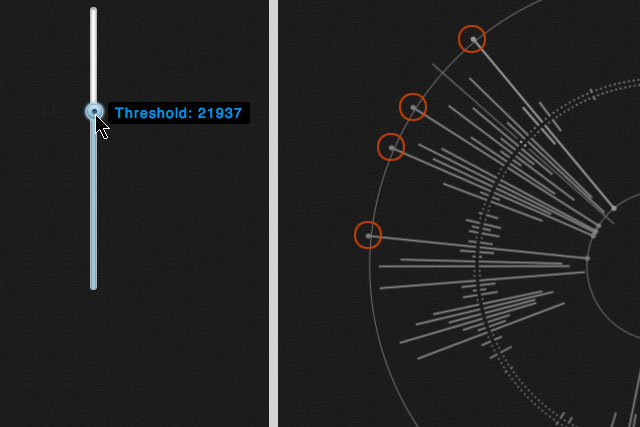
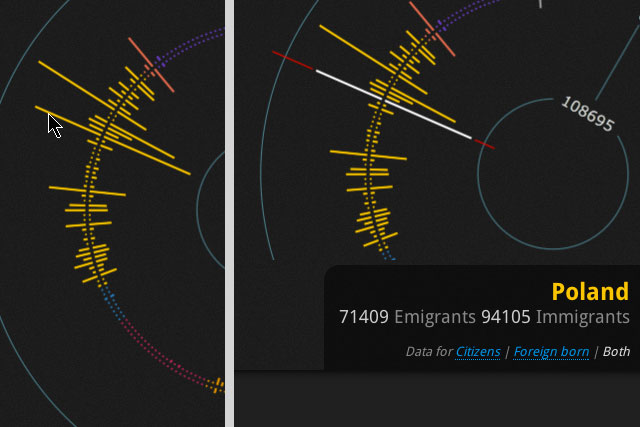
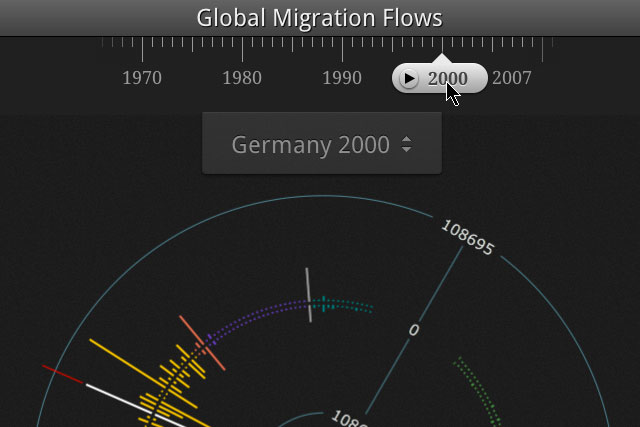
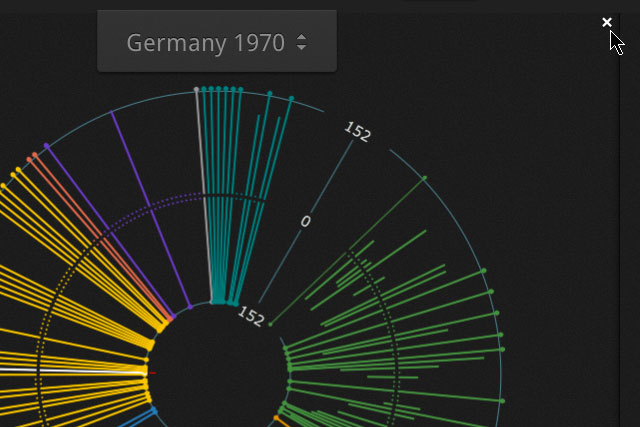
Global Migration Flows

1970 | |||||
| 1970 | 1980 | 1990 | 2000 | 2010 | 2018 |

It looks like you are using a version of the Internet Explorer browser.
For best performance of our interactive data graphics, you will need to install a plug-in.
Installing Google Chrome Frame will update the technology under the hood and dramatically increase javascript performance.
Your can then continue using your browser with all your settings remaining untouched.


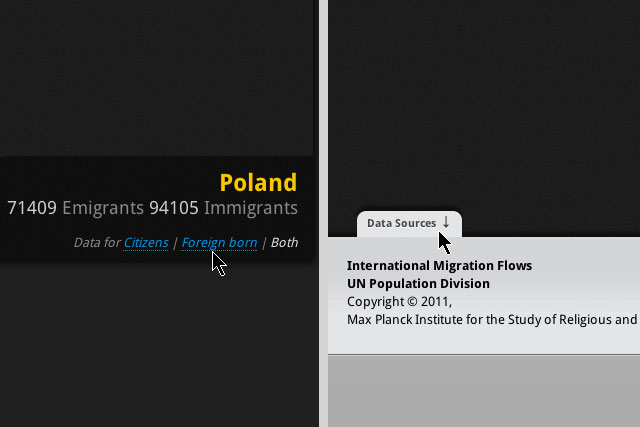
Copyright © 2011,
Max Planck Institute for the Study of Religious and Ethnic Diversity
For further information on UN Population Division data please refer to this document.
1970 | |||||
| 1970 | 1980 | 1990 | 2000 | 2010 | 2018 |